R/plot-raster.R
plot_raster.Rd
Plot points as a raster
plot_raster(data, field, fun = "sum", nrow = 100, ncol = 100, ...)
a spatial feature data.
the field to rasterize.
the function
number of rows
Other arguments passed on to geom_raster.
geom_raster
a ggplot.
x <- get_qma("CRA")
set.seed(4277)
pts <- sf::st_sf(sf::st_sample(x, size = 1000))
pts$z <- rnorm(nrow(pts))
ggplot2::ggplot() +
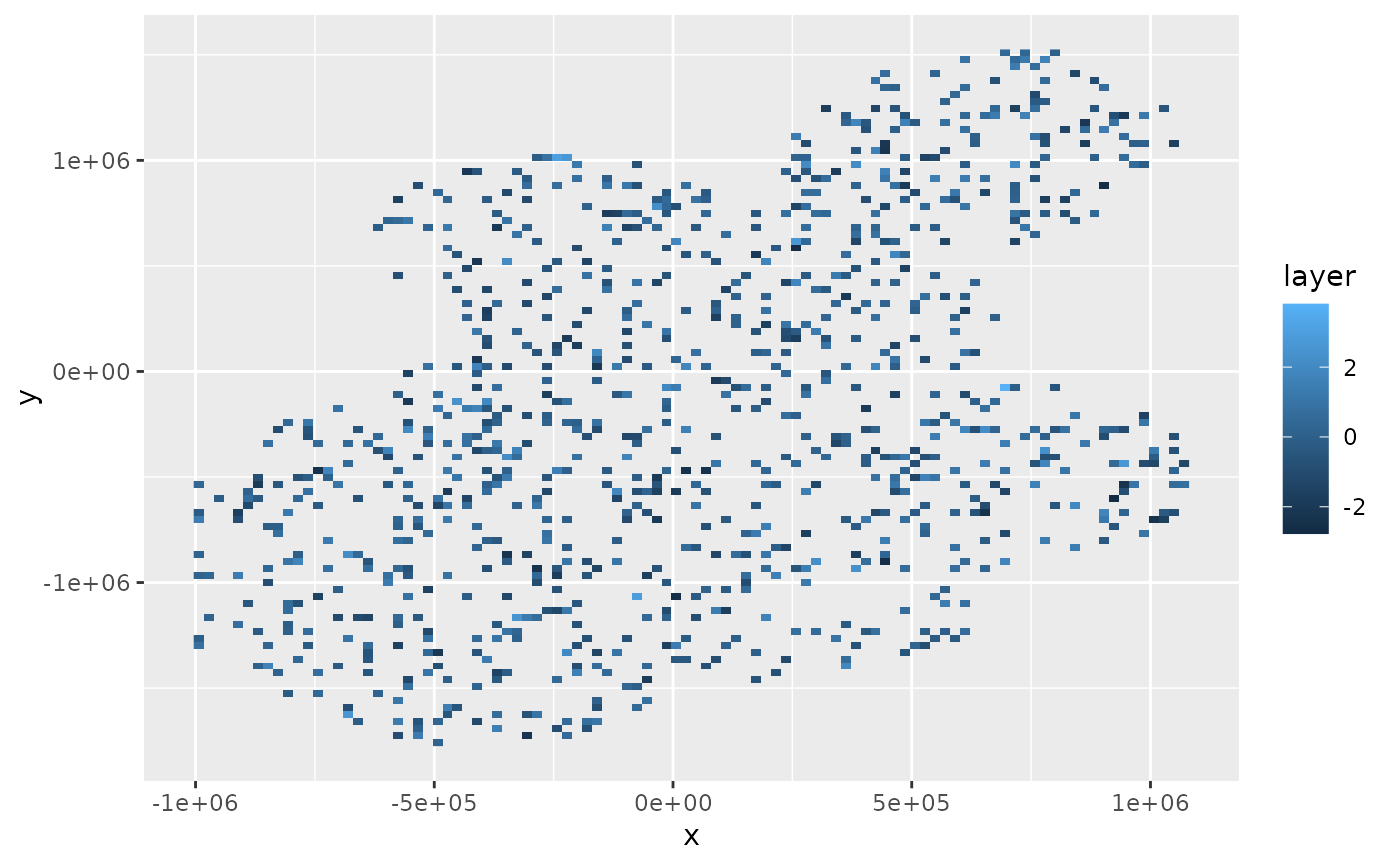
  plot_raster(data = pts, field = "z")