Usage
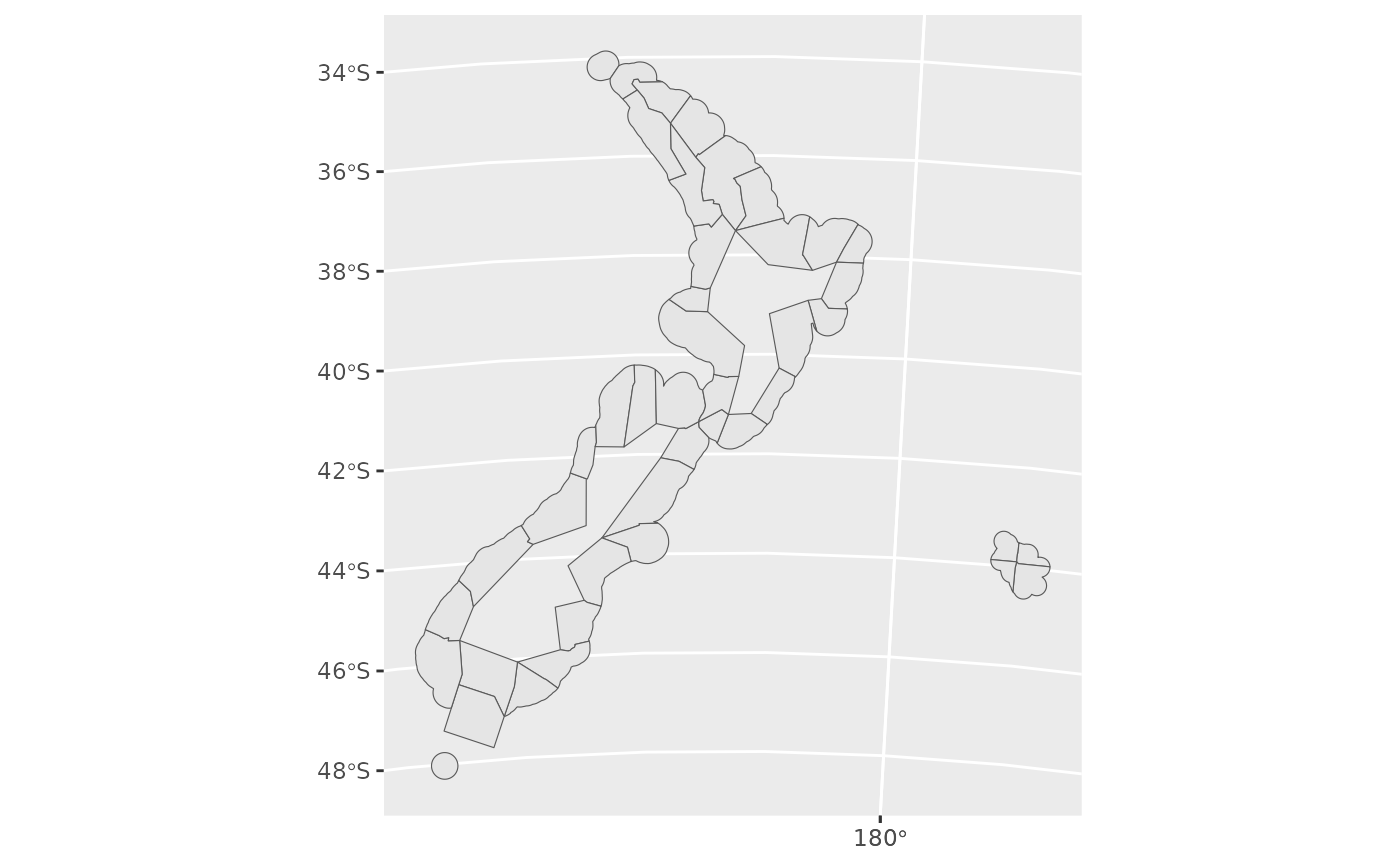
plot_statistical_areas(proj = proj_nzsf(), area = "CRA", ...)
Arguments
- proj
The projection to use.
- area
A fisheries area. Supported values include EEZ, CRA, FMA, JMA,
statistical areas, CCSBT, SIOFA, and SPRFMO.
- ...
Other arguments passed on to geom_sf.
Value
A ggplot of the selected QMA.
Examples
ggplot2::ggplot() +
  plot_statistical_areas(area = "CRA")