This function is used to plot a Quota Management Area (QMA) as a ggplot2 object.
Usage
plot_qma(qma = "CRA", proj = proj_nzsf(), ...)
Arguments
- qma
A Quota Management Area (QMA). Can be CRA, PHC, COC, ...
- proj
The coordinate reference system to use: integer with the EPSG code, or character with proj4string.
- ...
Other arguments passed on to geom_sf.
Value
A ggplot object of the selected QMA.
See also
get_qma to return Quota Management Area (QMA) polygons as sf objects.
Examples
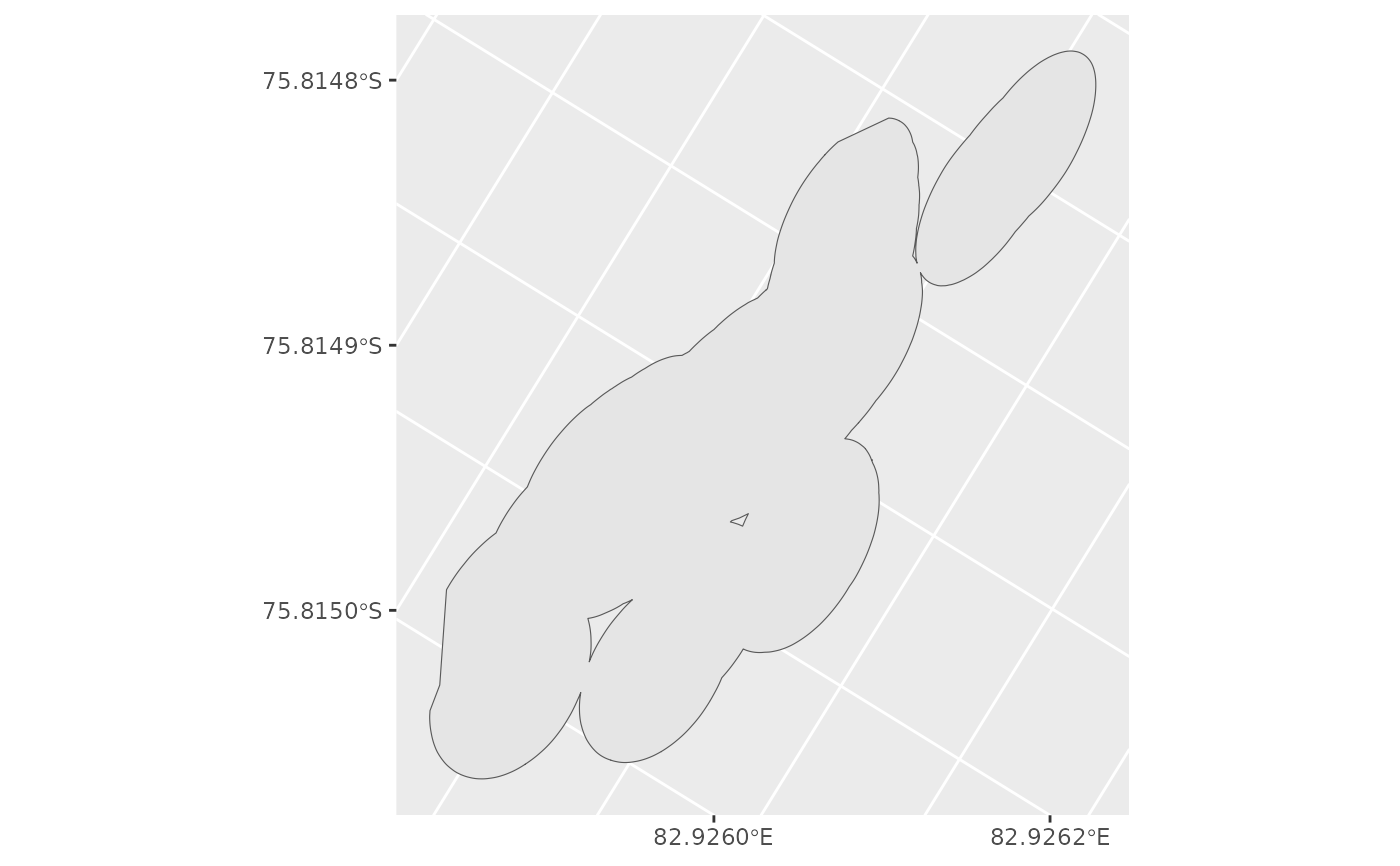
# Packhorse rock lobster
ggplot() +
plot_qma(qma = "PHC")
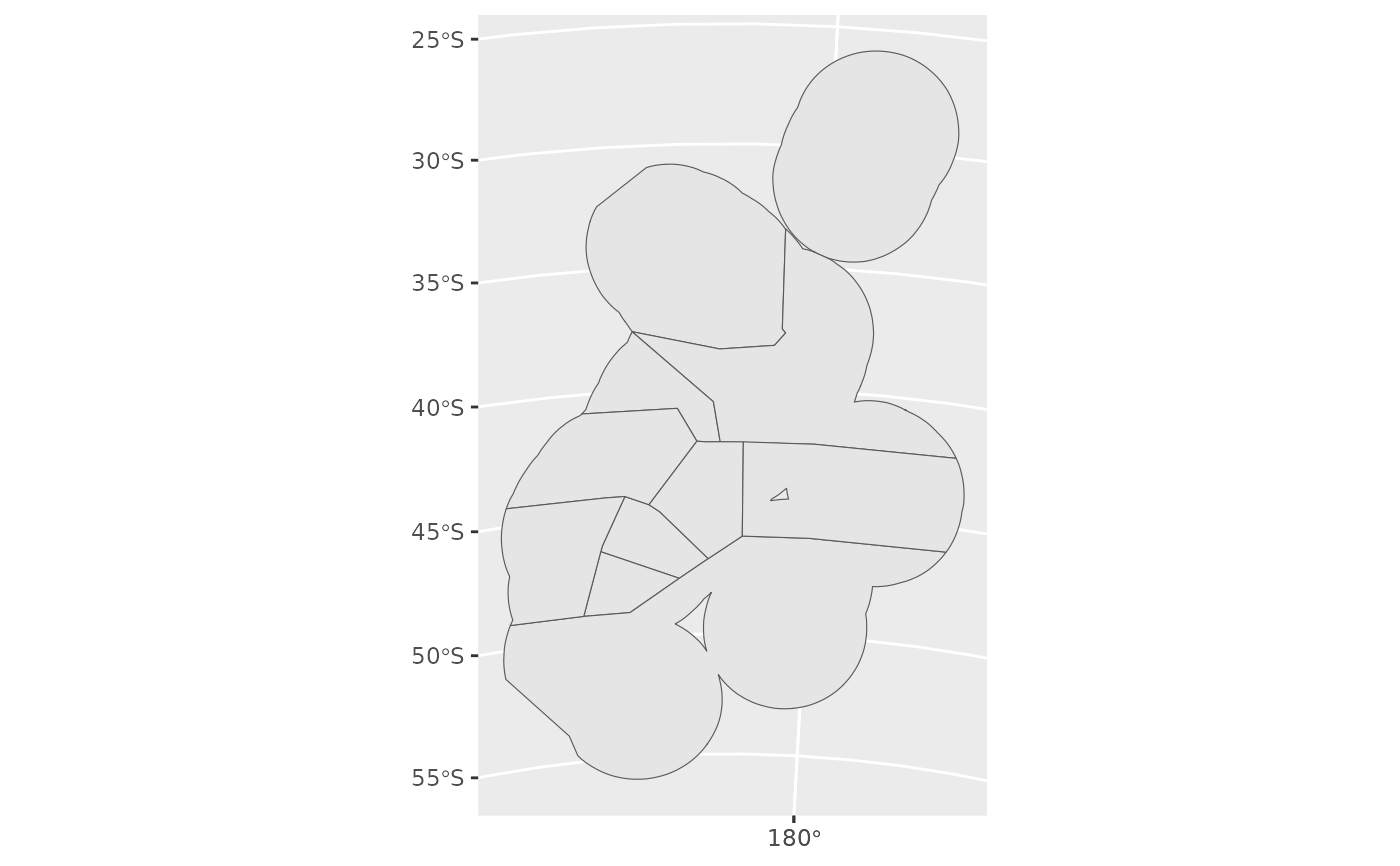
 # Jack mackerel
ggplot() +
plot_qma(qma = "JMA")
# Jack mackerel
ggplot() +
plot_qma(qma = "JMA")
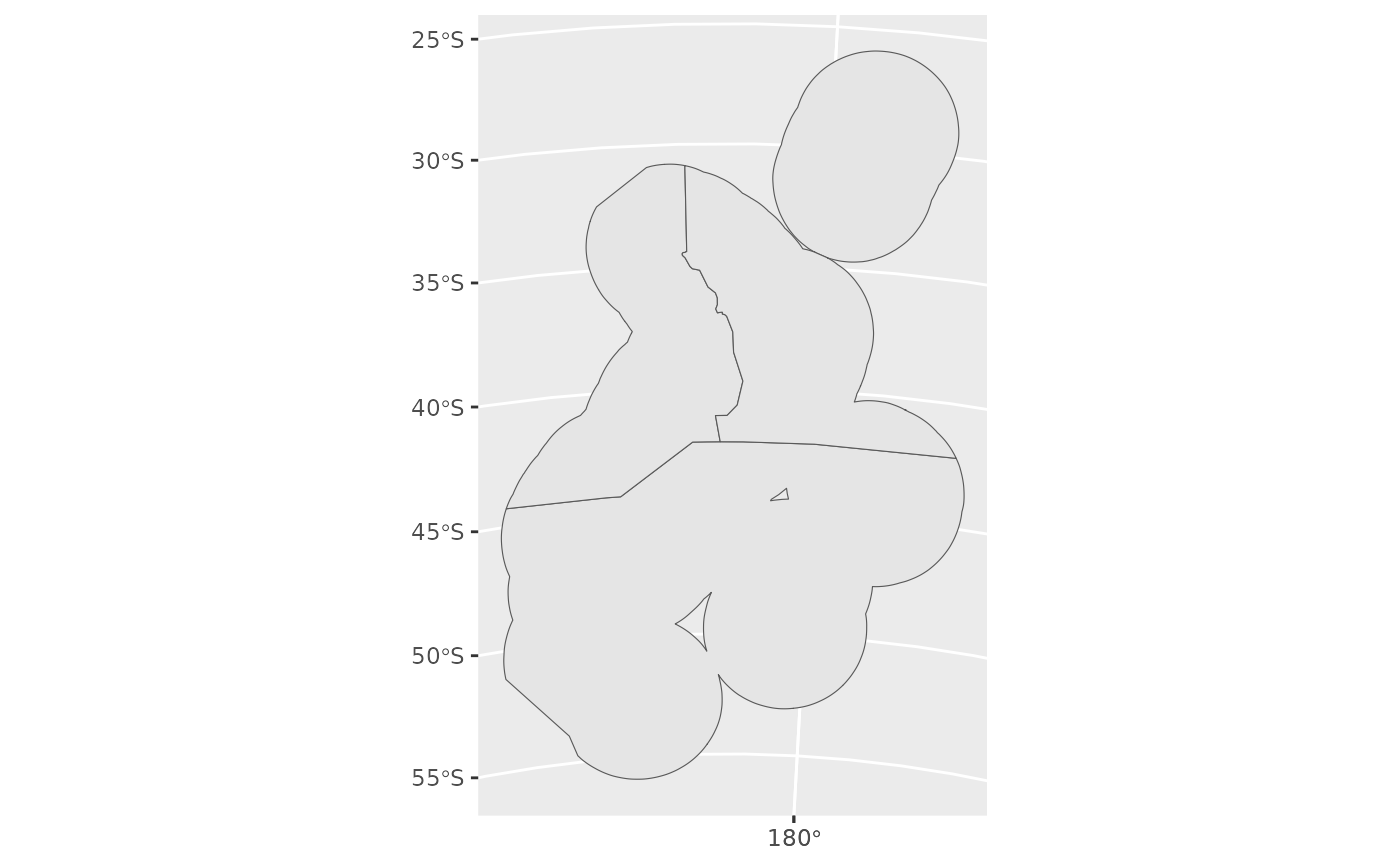 # Paua
ggplot() +
plot_qma(qma = "PAU")
# Paua
ggplot() +
plot_qma(qma = "PAU")