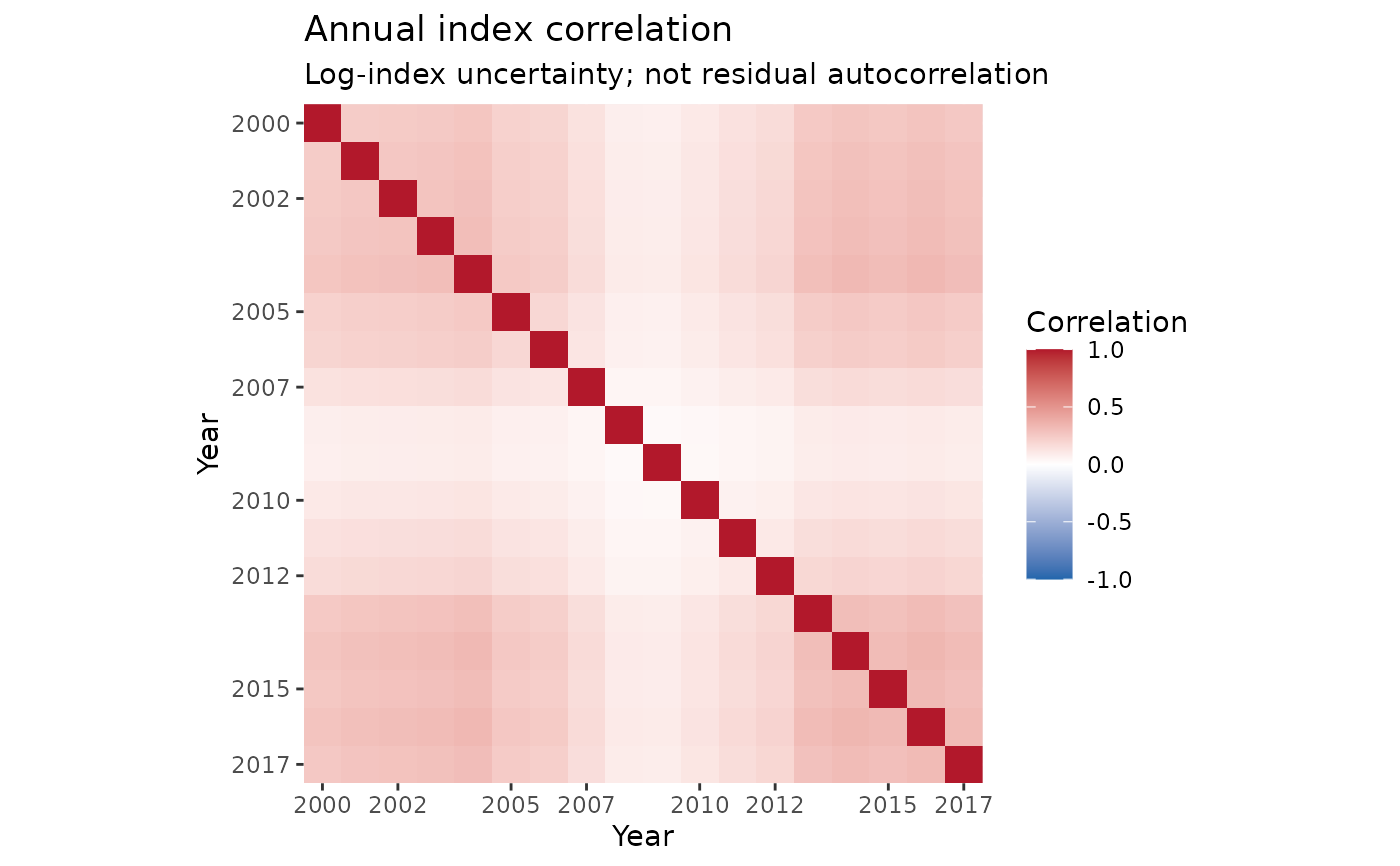
Retrieve the joint uncertainty of the annual expected-response index, not the model-coefficient covariance or observation-error covariance.
Arguments
- x, object
An
influ_indexfromcpue_index()orintegrate_index().- scale
"log"(default) for covariance of log annual indices, or"response"for covariance in the reported response units.- years
Optional unique year labels selecting and ordering both matrix dimensions. They must match
Yearin the index table exactly.- require_pd
If
TRUE, fail unless the selected matrix admits a Cholesky factorisation. No diagonal jitter or eigenvalue adjustment is applied. The default permits positive-semidefinite matrices.- ...
Reserved for future use; unused arguments are rejected.
Details
All six standardisation backends and area integration retain these compact matrices when uncertainty is calculated, including when only summaries are retained. GLM/GAM/glmmTMB covariance is obtained by propagating the joint fitted-parameter covariance through the weighted annual means. Log-scale covariance uses their log-index gradients. brms uses sample covariance of the same annual posterior draws, taking logs before calculating log covariance. sdmTMB/tinyVAST use their shared joint Gaussian parameter/field draws in the same way. Positive estimates and, where used, positive draws are required for log covariance; values are never clipped.
The matrix follows the index's reference population, random-effect target,
units, and normalisation. Multiplying by a known positive constant changes
response covariance by its square and leaves log covariance unchanged.
However, normalising every draw to geometric mean one, or applying the
corresponding delta method, makes log covariance singular: one common
log-level has been removed. Prefer rescale = "raw" for an assessment
estimating catchability. Other model structures or too few draws may also
yield singular matrices. Do not repair these silently to fit a likelihood.
Missing covariance cannot be reconstructed from marginal SDs. Old saved summaries, point-estimate previews, and year-effect diagnostics therefore fail explicitly. Recalculate the expected-response index with uncertainty. The matrix includes no additional assessment observation/process error, uncertainty in reference weights or catchability conversions, or cross-series covariance from separately calculated index objects.
Examples
data(lobsters_per_pot)
fit <- glm(lobsters ~ year + depth, poisson(), data = lobsters_per_pot)
index <- cpue_index(fit, reference_data = data.frame(depth = 40))
Sigma <- index_vcov(index)
sqrt(diag(Sigma)) # Joint-calculation log-index SEs, not observation SDs.
#>       2000       2001       2002       2003       2004       2005       2006
#> 0.06155697 0.06007582 0.05602997 0.05668880 0.05268207 0.06123325 0.05163021
#>       2007       2008       2009       2010       2011       2012       2013
#> 0.04759731 0.05069476 0.05140674 0.04670782 0.04441444 0.05102059 0.04381144
#>       2014       2015       2016       2017
#> 0.04242199 0.04590994 0.04327864 0.04484816
plot(index, type = "correlation")