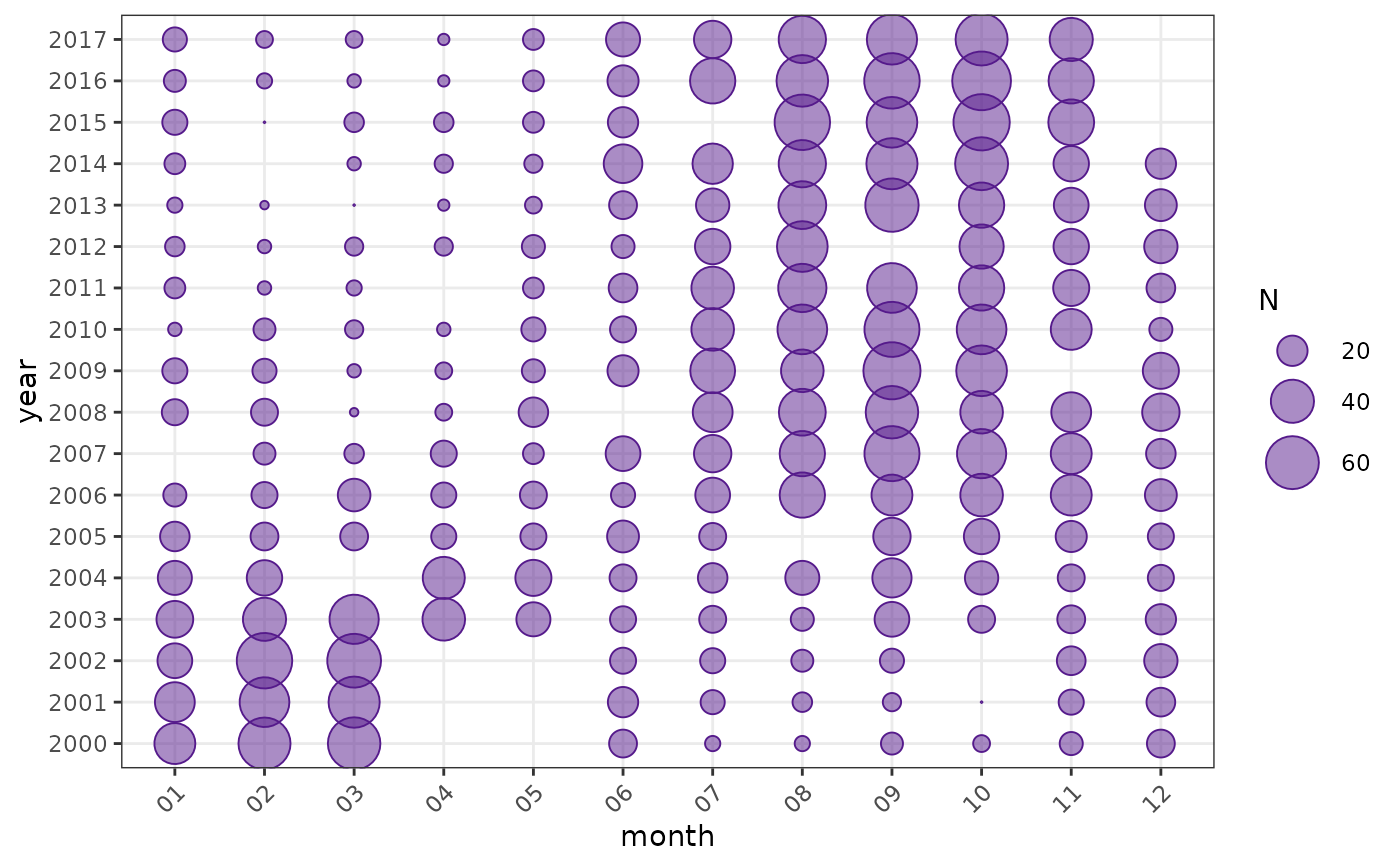
Summarises the number or proportion of records in each combination of two grouping variables and displays the result as a bubble plot.
Usage
plot_bubble(
  df,
  group = c("fishing_year", "vessel"),
  sort_order = NULL,
  sum_by = "raw",
  fill = "purple",
  alpha = 0.5,
  ylab = NULL,
  xlab = NULL,
  zlab = "N",
  ...
)
Arguments
- df
A data frame.
- group
Character vector naming the vertical and horizontal grouping variables, in that order.
- sort_order
Optional ordering for the horizontal grouping variable.
- sum_by
One of `"raw"`, `"all"`, `"row"`, or `"column"`.
- fill
A fixed colour, or the name of a column in `df` used to colour bubbles.
- alpha
Bubble transparency.
- xlab, ylab, zlab
Axis and size-legend labels.
- ...
Reserved for future plotting options.