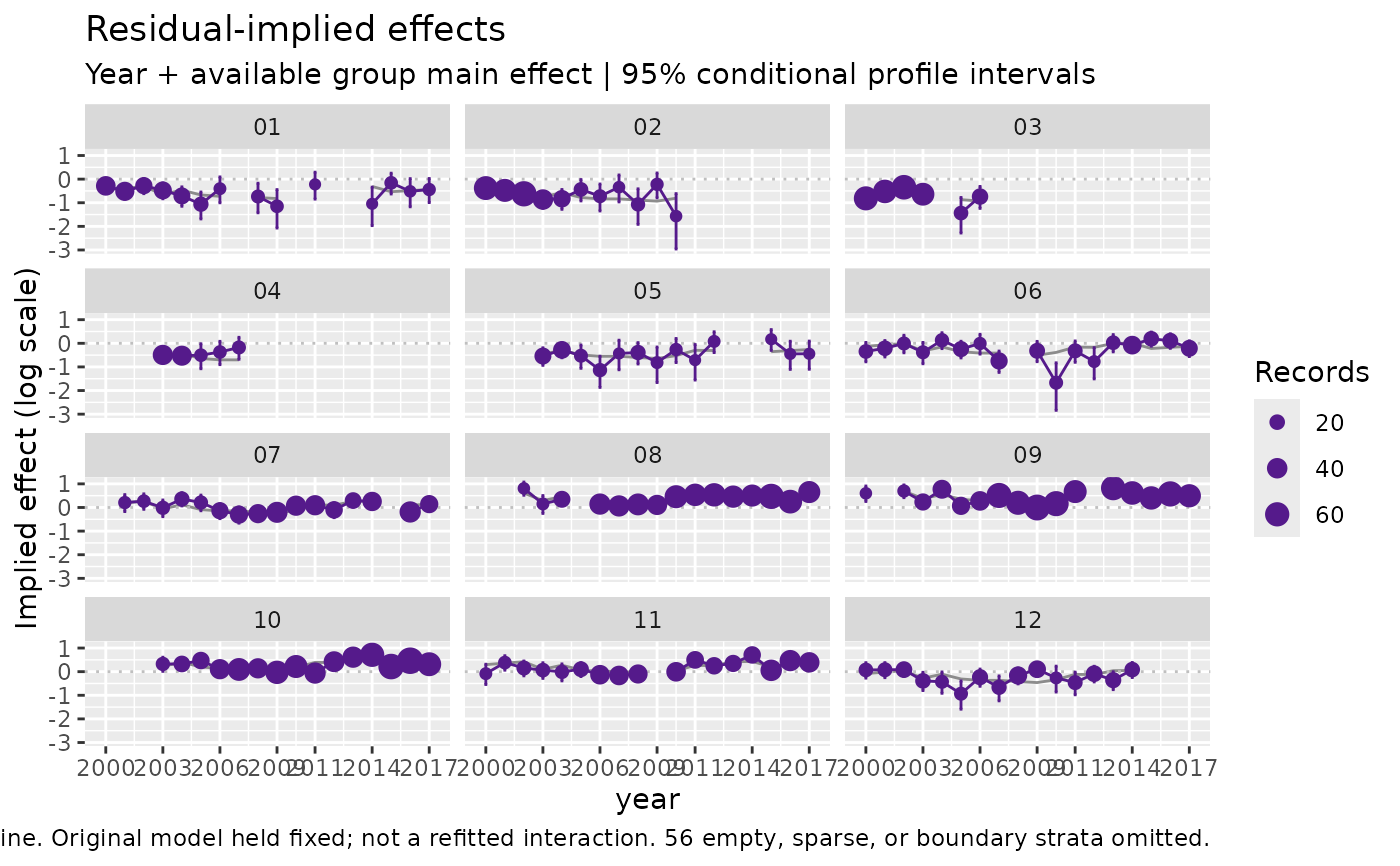
Display the fixed baseline and local residual-implied trajectories. This
restores the effect-scale question of the historical plot, with an explicit
traditional option. Use plot_grouped_residuals() for grouped PIT scores.
Usage
plot_implied_residuals(fit, colour = "purple4", ncol = 3L, ...)

# S3 method for class 'influ_implied'
plot(x, ...)

# S3 method for class 'influ_implied'
autoplot(object, ...)
Arguments
- fit
An
influ_impliedresult or a supported fitted model.- colour
Colour of implied-effect points, lines, and intervals.
- ncol
Number of facet columns, default three.
- ...
Calculation arguments passed to
implied_effects()for a fitted model, includingmethod = "traditional". Not accepted for stored results: calculate a separate result to change its method, interval, or baseline.- x, object
An `influ_implied` result.