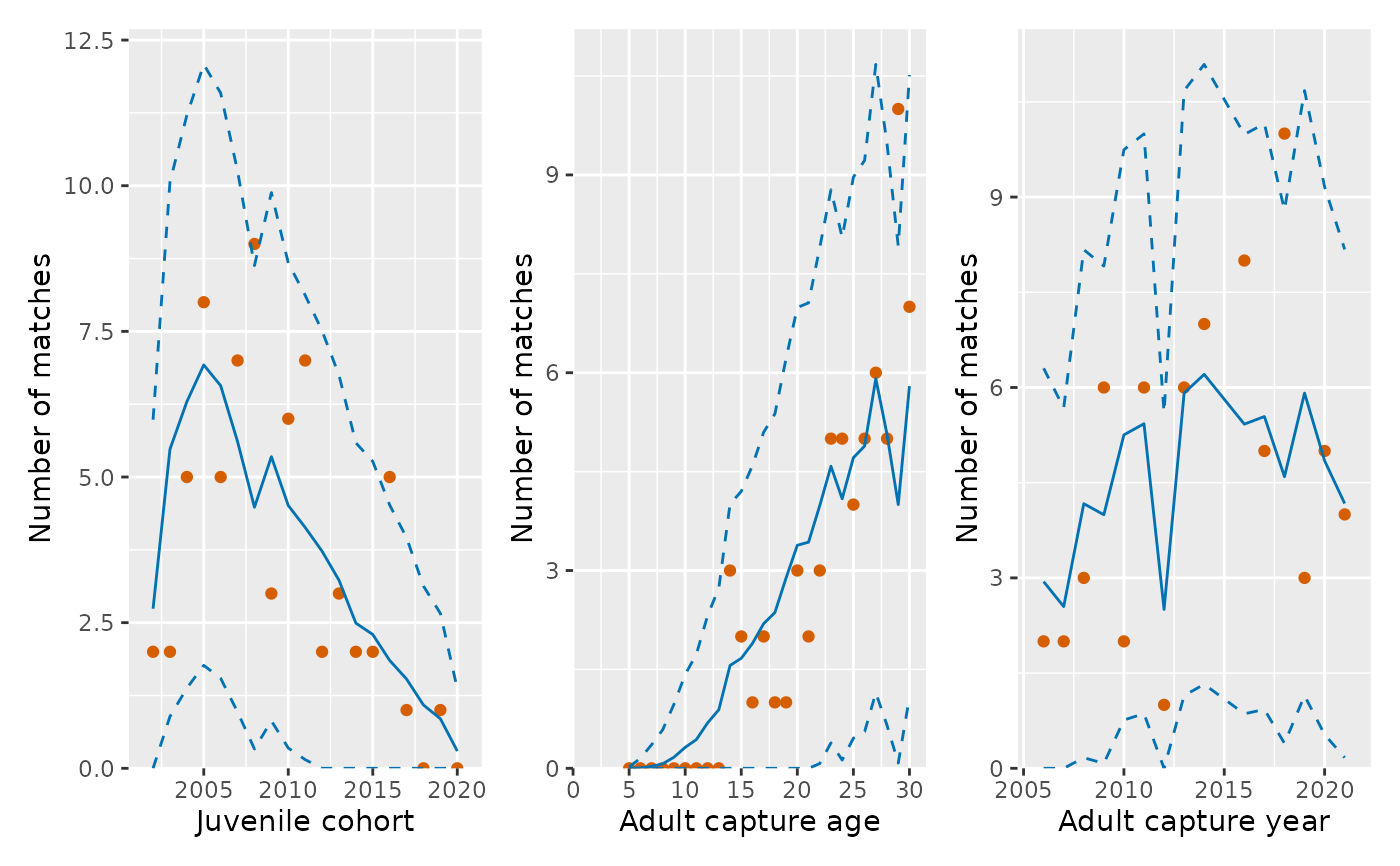
Plot parent-offspring-pair (POP) observations and fitted values by juvenile cohort, adult capture age, and adult capture year.
Usage
plot_pops(
  fit = NULL,
  object = NULL,
  return_list = FALSE,
  verbose = FALSE,
  observed_color = "#D55E00",
  predicted_color = "#0072B2",
  data = NULL
)
Arguments
- fit
An
sbt_fitobject. This diagnostic uses its fitted point estimate; posterior intervals are not materialized.- object
Legacy RTMB objective used only with a legacy data-list input.
- return_list
Logical. If
TRUE, return individual POP panels as a named list. IfFALSE, return the combined POP panel.- verbose
Logical. If
TRUE, print cohort progress messages.- observed_color
Color used for observed match counts.
- predicted_color
Color used for predicted match counts and intervals.
- data
Legacy named alias for a model data list; supply
objectas well.
Value
If return_list = FALSE, a patchwork object displaying POP
observations and fitted values. If return_list = TRUE, a named list
of POP fit plots.
Details
Displayed count intervals are conditional plug-in approximations and do not propagate posterior parameter uncertainty.
See also
Other diagnostic plots:
plot_af(),
plot_biomass_spawning(),
plot_cpue(),
plot_gt(),
plot_hsps(),
plot_lf(),
plot_recruitment(),
plot_selectivity(),
plot_tags(),
plot_tags_residuals()
Examples
fit <- sbt_example_fit()
#> Warning: Dependency versions differ: RTMBdist, TMB
#> Warning: Dependency versions differ: RTMBdist, TMB
plot_pops(fit)